


Build practical skills in Business Analytics, data analysis, business intelligence, reporting, and data visualization with TrainingYA’s Business Analytics Training in Bangalore.
The Business Analytics Course in Bangalore is designed for students, freshers, working professionals, graduates, entrepreneurs, and career switchers who want to develop practical skills for data-driven business decision-making. The program combines Tableau, Power BI, SQL, and Advanced Excel and focuses on applying these tools to real-world business problems.
Bangalore is one of India’s major technology and corporate hubs, with a large presence of IT companies, startups, e-commerce businesses, consulting organizations, and multinational corporations. This makes business analytics a relevant skill set for professionals looking to build careers in data and business intelligence.
Why Learn Business Analytics in 2026?
Businesses today depend on data to understand customers, monitor performance, identify trends, optimize operations, and make strategic decisions.
Business Analytics helps professionals convert raw business data into actionable insights.
With the right training, you can learn to:
- Analyze business data
- Extract information using SQL
- Clean and manipulate data
- Create business reports
- Track KPIs
- Build interactive dashboards
- Analyze sales and marketing performance
- Understand customer behavior
- Identify business trends
- Present insights to stakeholders
- Support data-driven decision-making

Business Analytics Course in Bangalore – Course Overview
TrainingYA’s Business Analytics program combines four major tools:
Advanced Excel
Used for data manipulation, analysis, reporting, calculations, and business dashboards.
SQL
Used to retrieve, filter, aggregate, and analyze data from databases.
Tableau
Used for data visualization, interactive reports, and business dashboards.
Power BI
Used for Business Intelligence, data modeling, visualization, and interactive reporting.
The official course structure describes the program as a combination of Tableau, Power BI, SQL, and Advanced Excel, with learners applying these technologies to business analytics problems.
Business Analytics Training Highlights
- Industry-oriented curriculum
- Training by industry experts
- Practical assignments
- Real-world case studies
- Hands-on projects
- Advanced Excel
- SQL
- Tableau
- Power BI
- Data visualization
- Interactive dashboards
- Business reporting
- Analytical problem-solving
- Career mentorship
- Resume assistance
- Interview preparation
- Placement assistance
- Online classes
- Offline classes
- Weekday classes
- Weekend classes
- Course completion certification
What Will You Learn in Business Analytics Training?
1. Advanced Excel
Advanced Excel is useful for business reporting, calculations, data cleaning, and analysis.
You can learn:
- Advanced Excel functions
- Lookup functions
- Logical functions
- Data cleaning
- Data formatting
- Data validation
- Conditional formatting
- Pivot Tables
- Pivot Charts
- Data analysis
- Business reporting
- Dashboard creation
2. SQL for Business Analytics
SQL is an important skill for working with data stored in relational databases.
The program covers areas such as:
- Database fundamentals
- SQL syntax
- SELECT statements
- Filtering data
- Sorting data
- Aggregate functions
- GROUP BY
- HAVING
- Joins
- Subqueries
- Data manipulation
- Business-oriented queries
3. Tableau Data Visualization
Tableau enables analysts to convert datasets into interactive visualizations and dashboards.
Training can cover:
- Tableau fundamentals
- Connecting data
- Data preparation
- Dimensions and measures
- Charts
- Filters
- Calculations
- Parameters
- Interactive visualizations
- Dashboard creation
- Data storytelling
- Business reporting
4. Power BI
Power BI is used for Business Intelligence, reporting, data visualization, and dashboard development.
Key areas include:
- Power BI Desktop
- Data import
- Data sources
- Power Query
- Data transformation
- Data modeling
- Relationships
- DAX
- Measures
- Calculated columns
- Charts
- Filters
- Slicers
- Interactive reports
- Dashboard development
- Power BI Service
- Report publishing
- Data refresh
Why Choose Business Analytics Training in Bangalore?
Bangalore is often referred to as India’s technology capital and has a strong concentration of IT companies, startups, multinational corporations, e-commerce businesses, consulting firms, and technology-driven organizations.
This creates an environment where skills related to data analysis, reporting, Business Intelligence, and data-driven decision-making are highly relevant.
Strong IT Ecosystem
Bangalore has a large technology ecosystem with companies working across software, cloud, fintech, e-commerce, SaaS, and other technology sectors.
Startup Opportunities
Startups use analytics to understand customers, measure growth, optimize marketing, and track business performance.
Corporate Environment
Large organizations use analytics for finance, sales, operations, marketing, HR, customer analytics, and strategic planning.
Multiple Career Paths
Business Analytics skills can be applied to roles such as Business Analyst, Data Analyst, BI Analyst, Reporting Analyst, and Product Analyst.
Career Opportunities After Business Analytics Course in Bangalore
After developing the required analytical and technical skills, learners can explore roles such as:
Business Analyst
Analyze business requirements, processes, performance, and data to support business decisions.
Data Analyst
Work with datasets, identify patterns, prepare reports, and generate business insights.
Business Intelligence Analyst
Develop interactive dashboards and reports using BI platforms such as Power BI and Tableau.
Reporting Analyst
Create recurring reports, KPI dashboards, and management reports.
MIS Analyst
Use Excel, SQL, and visualization tools for reporting and management information systems.
Product Analyst
Analyze product usage, customer behavior, KPIs, and business performance.
Marketing Analyst
Analyze campaigns, customer acquisition, conversions, and marketing performance.
Operations Analyst
Use business data to identify operational trends and opportunities for improvement.
Who Should Join Business Analytics Training in Bangalore?
Students & Graduates
Students from engineering, commerce, science, mathematics, business management, BBA, B.Com, BCA, MCA, BSc, and related backgrounds can build practical analytics skills.
TrainingYA states that candidates from science, commerce, arts, engineering, finance, mathematics, business management, BA, B.Com, CA, BCA, MCA, BSc, and other backgrounds can join, including candidates without a coding background who are willing to learn from the basics.
Freshers
Freshers can learn multiple analytics tools and create projects that demonstrate practical skills.
Working Professionals
Professionals working in MIS, finance, sales, marketing, HR, operations, or reporting can strengthen their analytical capabilities.
Career Switchers
Professionals planning to move into analytics can build a structured foundation in Excel, SQL, Tableau, and Power BI.
Entrepreneurs & Business Owners
Business owners can learn how to use data and dashboards to monitor performance and support better business decisions.
Do You Need a Coding Background?
No, an advanced programming background is not mandatory.
TrainingYA’s Business Analytics program is designed for learners from different educational backgrounds, including candidates with zero coding background who are willing to learn the fundamentals.
However, regular practice is important, particularly for SQL, data analysis, and dashboard development.
Training Modes
TrainingYA provides flexible learning options for the program.
Online Classes
Learn remotely through instructor-led sessions and practical learning.
Offline Classes
Classroom-based learning for learners who prefer face-to-face interaction.
Weekday Classes
Suitable for students and professionals who can attend during weekdays.
Weekend Classes
Useful for working professionals who want to develop new skills without disrupting their work schedule.
TrainingYA officially lists online, weekday, and weekend learning options, with weekend classes specifically positioned for working professionals.
Business Analytics Certification
After completing the program, learners can use the course completion certification to demonstrate their Business Analytics training.
Certification can help you:
- Add relevant training to your resume
- Showcase learning on LinkedIn
- Support job applications
- Demonstrate structured training
- Complement your project portfolio
Business Analytics Tools Covered
| Tool | Primary Purpose |
| Advanced Excel | Data analysis & reporting |
| SQL | Database querying & data extraction |
| Tableau | Data visualization & dashboards |
| Power BI | Business Intelligence & interactive reporting |
Business Analytics vs Data Analytics
| Business Analytics | Data Analytics |
| Strong focus on business decisions | Strong focus on analyzing datasets |
| Connects insights with business objectives | Identifies patterns and trends |
| Focuses on business performance | Focuses on data processing and interpretation |
| Often involves KPIs and reporting | Can involve broader analytical techniques |
| Excel, SQL, Tableau, Power BI | SQL, Excel, Python, BI tools, statistics |
Business Analytics vs Data Science
| Business Analytics | Data Science |
| Business decision-making | Advanced analytical modeling |
| Reporting & visualization | Machine learning & predictive modeling |
| Excel, SQL, Tableau, Power BI | Python, SQL, statistics, ML |
| Business KPIs | Predictive insights |
| Strong business focus | Strong technical/statistical focus |
Career Growth After Business Analytics Training
Business Analytics can provide a foundation for broader careers in analytics and Business Intelligence.
Professionals can strengthen their profiles by adding:
- Advanced SQL
- Advanced Excel
- Power BI
- Tableau
- Python
- Statistics
- Data Storytelling
- Business Communication
- Domain Knowledge
A learner can start with Excel + SQL, add Power BI + Tableau, and later learn Python and statistics for more advanced analytics opportunities.
Why Choose TrainingYA?
TrainingYA combines several widely used analytics and BI tools into one structured Business Analytics program.
Key Benefits
- Industry-oriented curriculum
- Industry-expert trainers
- Advanced Excel
- SQL
- Tableau
- Power BI
- Practical assignments
- Case studies
- Real-world projects
- Online learning
- Offline learning
- Weekday classes
- Weekend classes
- Career mentorship
- Resume assistance
- Interview preparation
- Placement support
- Certification
Course Curriculum
- Introduction to Business Analytics
- Business Intelligence
- Data-driven decision-making
- Business problems and analytical solutions
- Business data
- Analytical thinking
- Business reporting
- KPIs and performance measurement
- Excel fundamentals
- Advanced formulas
- Lookup functions
- Logical functions
- Data cleaning
- Data validation
- Conditional formatting
- Pivot Tables
- Pivot Charts
- Data analysis
- Business reporting
- Dashboard development
- Database fundamentals
- SQL queries
- SELECT
- WHERE
- ORDER BY
- GROUP BY
- Aggregate functions
- Joins
- Subqueries
- Data manipulation
- Business analytics queries
- Tableau introduction
- Data connection
- Data preparation
- Dimensions and measures
- Charts
- Filters
- Calculations
- Parameters
- Interactive dashboards
- Data storytelling
- Business reporting
- Power BI Desktop
- Data sources
- Power Query
- Data transformation
- Data modeling
- Relationships
- DAX
- Measures
- Visualizations
- Filters and slicers
- Interactive reports
- Dashboard development
- Power BI Service
- Publishing and sharing
- Sales
- Finance
- Marketing
- HR
- Customer analysis
- Business performance
- Reporting
- KPIs
Key Recruiters


Don't Just Take Our Word For It. See How TrainingYA Transformed Lives

Pramod Singh
The Business Analytics course at TrainingYA (Earlier CTC) Data Science Training Institute provided me with knowledge of the industry demanded tools. Along with this, I get an opportunity to practice my skills through various assignments and case studies that are given to us in the workshops and classes. The trainers start the course with basic classes which gave us an introduction to the various tools. I have been very satisfied with my learning experience so far with TrainingYA.

Yushant Karki
The faculty members at TrainingYA are very supportive. I had joined their 360 Degree Data Science course as I was a fresher from a non-technical background who wanted an in-depth knowledge of the field of Data Science. They started all the concepts right from the basics which I was able to get a hold of easily. Their workshops made it even easier for me to understand all the concepts as I got hands on experience. I am still learning at the institute and hope I can get placed with their help just like the others whom I have seen getting placed.

Aman Rawat
TrainingYA (Earlier CTC) helped me a lot to enhance my skillset. I learned different tools here and as I was a newbie in this field so they started from the very basic for better understanding. The best thing about TrainingYA is that they focus on market trend and practical knowledge so that one can easily get in the industry even if they are not from the technical background. I have seen fresher’s and experienced people from various backgrounds get jobs into the world of Data Science with the help of TrainingYA. The best part if you can go as per your own speed. They truly know who to turn a profile around.

Tanya Hora
I would very much like to recommend TrainingYA (Earlier CTC) Data Science institute to everyone looking for a transition. I joined this institute recently and have been every happy with the learning. They are very dedicated towards practical knowledge and focus on the same through case studies and assignments. Along with this they conduct mock interviews to prepare us for the placement interviews. I am very satisfied with their training program. They have got some of my classmates placed in just 2 months from joining. I am going through the placement process as of now and I am hopeful that I will so get placed too. My college friend who recommended me this institute is already placed in Vortex organisation in just 45 days after joining. I am very optimistic and thank for TrainingYA for all their efforts.

Yatin Wasen
I believe that TrainingYA (Earlier CTC) institute is the best training institute for Data Science. I joined their 360-degree Data Science Course as I did not belong to a technical background and still wanted an in depth knowledge of the Data Science field. TrainingYA provided me with relevant and practical knowledge through workshops, case studies and assignments. They helped me throughout my transition period from Commerce background to the Data Science world. The faculty members were all experienced and very supportive. They were all working professionals and had experience of 8+ years. So their way of teaching gave us an insight into how things actually happen in the industry. I got my first offer within 1.5 months of joining the course. Currently, I have not completed the course. But I have already been placed through the course. Within completing only 30% of the course I had got 3 offers. So, I would recommend everyone who wishes to have a transition in their career to join TrainingYA Institute they truly helped me a lot.

Manisha Sardana
Hi I recently joined TrainingYA, the Data Science Institute because I was looking for a top-notch program that would teach me how to use data in a real-world setting. I’m so glad I found the Institute at Gurugram. The faculties at this Institute are some of the best in the industry, and they’ve been incredibly supportive. I will surely recommend this to all.
Your Journey: From Learning to Earning
FAQs about Business Analytics Training in Bangalore
Depending on the course and its duration, the fees may differ greatly. An all-inclusive, employment-based program may cost between 20,000 and 90,000, and postgraduate degrees may be much higher.
No, a technical background is not necessary. Several courses offer introductory courses, beginning with some basic knowledge, and then learners are introduced to the main technical applications.
You may become a Business Analyst, Data Analyst, Financial Analyst, Marketing Analyst, or even a Data Scientist, and the demand is high in all industries in Bangalore.
Yes, the majority of the reputable training institutions in Bangalore can provide them with good placement services, as they assist students with resume making, interview preparation, and linking them with the companies that employ.
A certificate program may take a span of three to six months, depending on the part-time or full-time schedule.
Got more questions? Talk to us
Connect with a program advisor and get your queries resolved
Speak with our expert +91-7303066379 or email to trainingya.team@gmail.com
Explore Your Next Skill
Program Related Blogs
How AI Agents Are Changing the Future of Data Science in 2026
The Bottleneck in Modern Data Teams and the Agentic Era For over ten years enterprise data teams have had to... read more
Why Python for Data Science Is the Most Important Programming Language for Data Professionals
For experienced analysts, BI developers, managers and technical professionals, the greatest difficulty in today's data challenge is in combining... read more
Power BI vs. Tableau for Data Analysts: What’s the Difference?
A hands-on comparison of data preparation, engine performance, visualization, teamwork, AI, cost, and how useful it is for your... read more
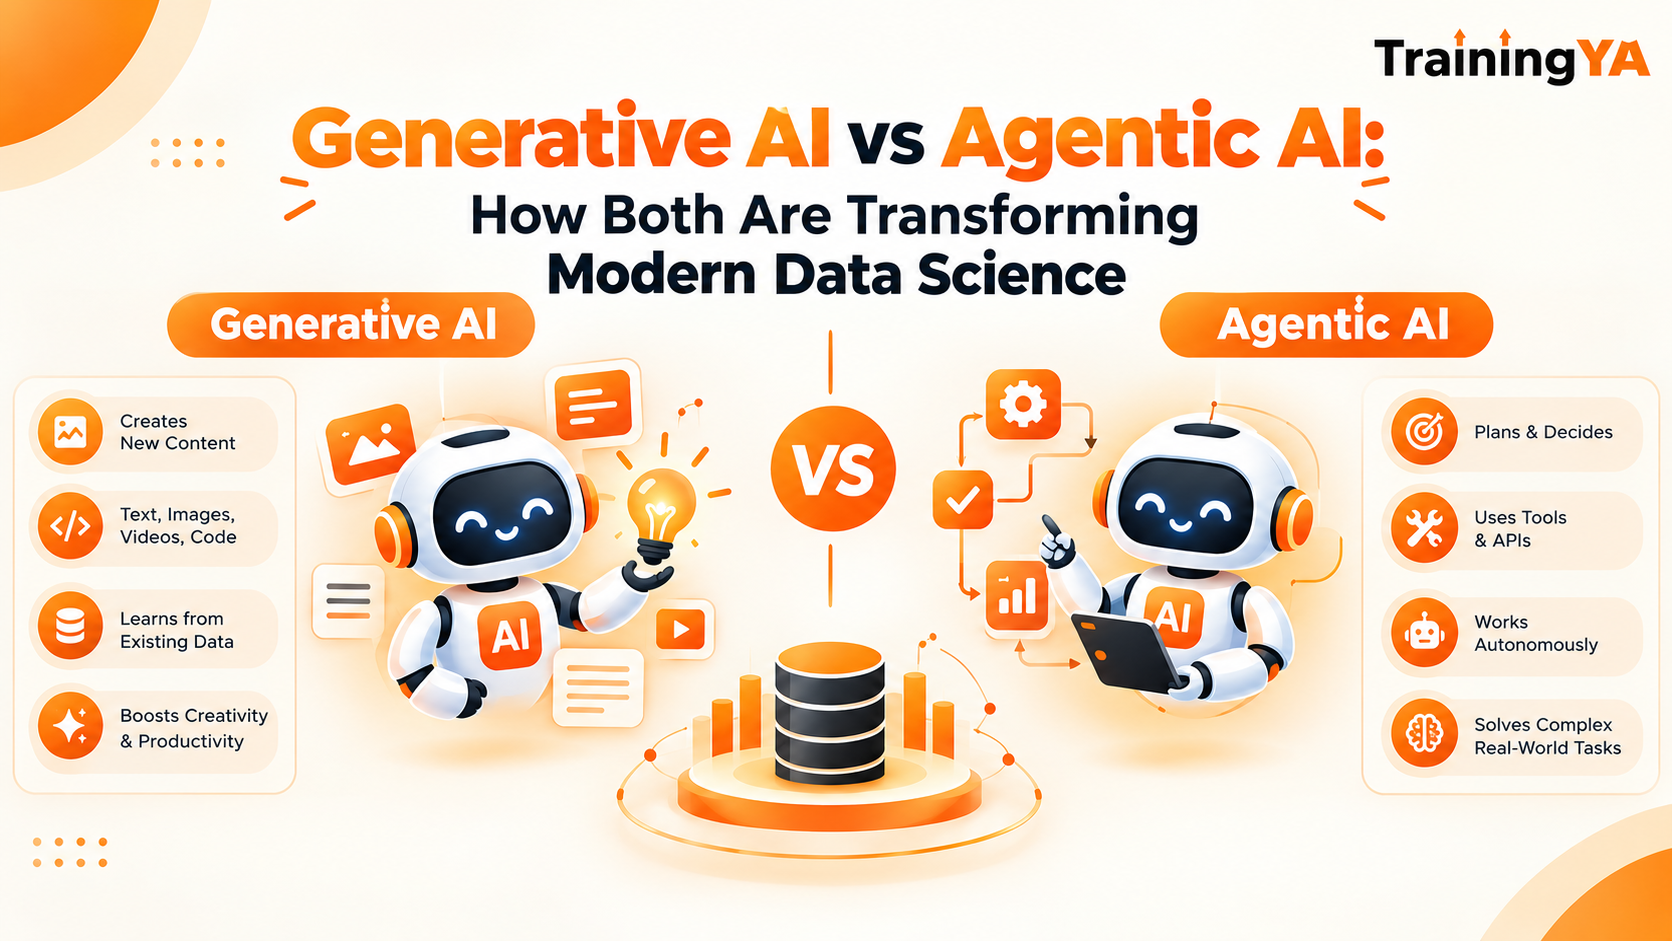
Generative AI vs Agentic AI: How Both Are Transforming Modern Data Science
Generative AI creates content, code, summaries, and analyses based on a prompt, while agentic AI goes a step further... read more

10 Essential Skills Every Data Analyst Should Learn in 2026
Data can be found everywhere. Businesses make use of data in order to understand their customers, improve their products,... read more

How to Become a Data Scientist with Generative AI and Agentic AI Skills in 2026
Introduction Data Science is currently one of the most popular and advanced career paths in the field of technology. However, as... read more

Top 15 Most Demanding Courses in Future
Choosing the right course today can completely change your future income and career growth. With industries rapidly evolving in... read more

Top 10 Computer Courses In Demand In India
Every year, I meet students who ask the same question in different ways: “Which course will actually get me... read more