
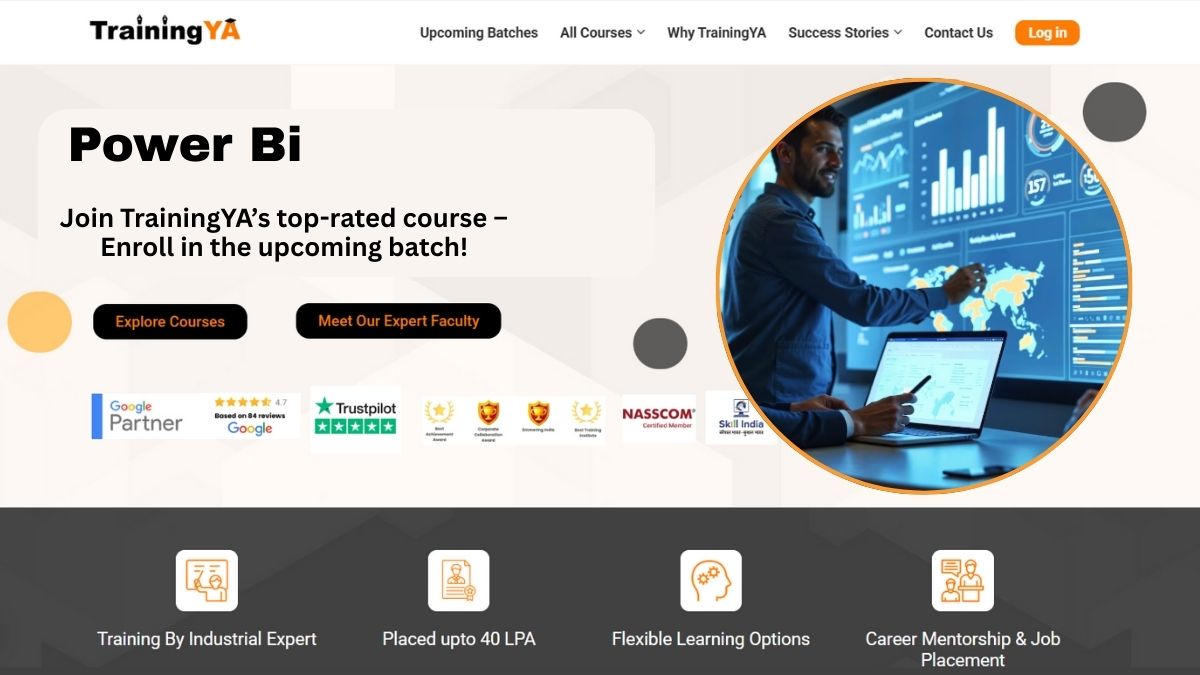

Power BI is a leading business analytics tool that allows users to visualize and analyse data in interactive and intuitive ways.
Power Bi Training Institute in Gurugram
Download Brochure
Get Quick Call Back Explore Course


Training By Industrial Expert

Placement upto 40 LPA

Flexible Learning Options

Career Mentorship & Job Placement
Course Overview
In today’s business environment, organizations rely heavily on data visualization and business intelligence tools to make faster and smarter decisions. Companies across industries generate large amounts of business data every day, and analyzing that information effectively has become essential for improving operations, customer experiences, and strategic planning. Microsoft Power BI has emerged as one of the most popular business intelligence platforms for creating interactive dashboards, analytical reports, and real-time data visualizations. Our industry-oriented Power BI course is designed to help learners develop practical business intelligence and reporting skills required in modern organizations.


Power Bi Training Institute in Gurugram
Power BI is a leading business analytics tool that allows users to visualize and analyse data in interactive and intuitive ways. It enables users to connect to various data sources, transform raw data into visually compelling reports and dashboards, and share insights with stakeholders.
Power BI is a suite of business analytics tools developed by Microsoft that enables users to visualize and share insights from their data. It allows users to connect to various data sources, including databases, cloud services, and spreadsheets, and transform raw data into visually compelling reports and dashboards.

Power Bi Course Detail
It is a powerful tool that helps individuals and companies to transform their data into insightful and interactive visualizations. The course will help students with the usage of Power BI to create dynamic dashboards and reports, connect to various data sources and conduct data modeling and analysis.
Hands on exposure will be given to students while working with Power BI desktop and power BI service throughout the course. They will learn how to design and create visually compelling stories, charts and graphs that can be shared with others within their organization.

Power BI Course Highlights
It is a powerful tool that helps individuals and companies to transform their data into insightful and interactive visualizations. The course will help students with the usage of Power BI to create dynamic dashboards and reports, connect to various data sources and conduct data modelling and analysis.
Hands on exposure will be given to students while working with Power BI desktop and power BI service throughout the course. They will learn how to design and create visually compelling stories, charts and graphs that can be shared with others within their organization.
Who Should Enroll:
- Data Analysts and Business Intelligence Professionals
- Data Scientists
- IT Professionals
- Students and Graduates
- Marketing Analysts
- Anyone Interested in Data Visualization

Programming Tools & Language


Online Classes
we offer both online and offline classes with a strong focus on technical skills, real-world tools, and industry-relevant projects—allowing you to learn at your own pace, anytime, anywhere.

Weekdays Classes
weekly classes led by industry experts, focused on real-time projects and only the most relevant tools and topics—no fluff, just job-ready skills.

Weekend Classes
weekend classes designed for working professionals, making it easy to upskill without disrupting your job. Learn directly from industry experts through real-world projects and practical tools that fast-track your growth.


Don't Just Take Our Word For It. See How TrainingYA Transformed Lives

Pramod Singh
The Business Analytics course at TrainingYA (Earlier CTC) Data Science Training Institute provided me with knowledge of the industry demanded tools. Along with this, I get an opportunity to practice my skills through various assignments and case studies that are given to us in the workshops and classes. The trainers start the course with basic classes which gave us an introduction to the various tools. I have been very satisfied with my learning experience so far with TrainingYA.

Yushant Karki
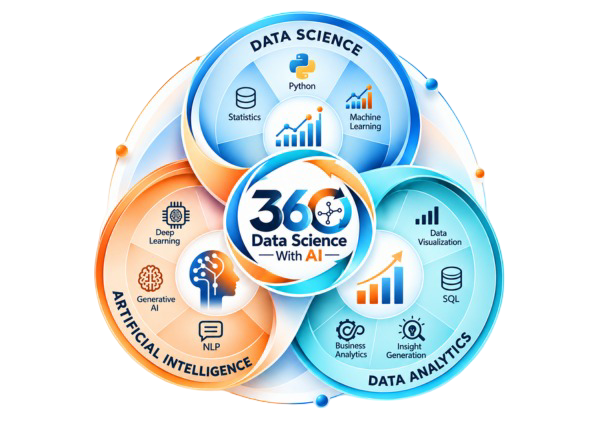
The faculty members at TrainingYA are very supportive. I had joined their 360 Degree Data Science course as I was a fresher from a non-technical background who wanted an in-depth knowledge of the field of Data Science. They started all the concepts right from the basics which I was able to get a hold of easily. Their workshops made it even easier for me to understand all the concepts as I got hands on experience. I am still learning at the institute and hope I can get placed with their help just like the others whom I have seen getting placed.

Aman Rawat
TrainingYA (Earlier CTC) helped me a lot to enhance my skillset. I learned different tools here and as I was a newbie in this field so they started from the very basic for better understanding. The best thing about TrainingYA is that they focus on market trend and practical knowledge so that one can easily get in the industry even if they are not from the technical background. I have seen fresher’s and experienced people from various backgrounds get jobs into the world of Data Science with the help of TrainingYA. The best part if you can go as per your own speed. They truly know who to turn a profile around.

Tanya Hora
I would very much like to recommend TrainingYA (Earlier CTC) Data Science institute to everyone looking for a transition. I joined this institute recently and have been every happy with the learning. They are very dedicated towards practical knowledge and focus on the same through case studies and assignments. Along with this they conduct mock interviews to prepare us for the placement interviews. I am very satisfied with their training program. They have got some of my classmates placed in just 2 months from joining. I am going through the placement process as of now and I am hopeful that I will so get placed too. My college friend who recommended me this institute is already placed in Vortex organisation in just 45 days after joining. I am very optimistic and thank for TrainingYA for all their efforts.

Yatin Wasen
I believe that TrainingYA (Earlier CTC) institute is the best training institute for Data Science. I joined their 360-degree Data Science Course as I did not belong to a technical background and still wanted an in depth knowledge of the Data Science field. TrainingYA provided me with relevant and practical knowledge through workshops, case studies and assignments. They helped me throughout my transition period from Commerce background to the Data Science world. The faculty members were all experienced and very supportive. They were all working professionals and had experience of 8+ years. So their way of teaching gave us an insight into how things actually happen in the industry. I got my first offer within 1.5 months of joining the course. Currently, I have not completed the course. But I have already been placed through the course. Within completing only 30% of the course I had got 3 offers. So, I would recommend everyone who wishes to have a transition in their career to join TrainingYA Institute they truly helped me a lot.

Manisha Sardana
Hi I recently joined TrainingYA, the Data Science Institute because I was looking for a top-notch program that would teach me how to use data in a real-world setting. I’m so glad I found the Institute at Gurugram. The faculties at this Institute are some of the best in the industry, and they’ve been incredibly supportive. I will surely recommend this to all.
Your Journey: From Learning to Earning
Explore More Courses
Join our industry-oriented courses to build high-in-demand career skills for a brighter future!
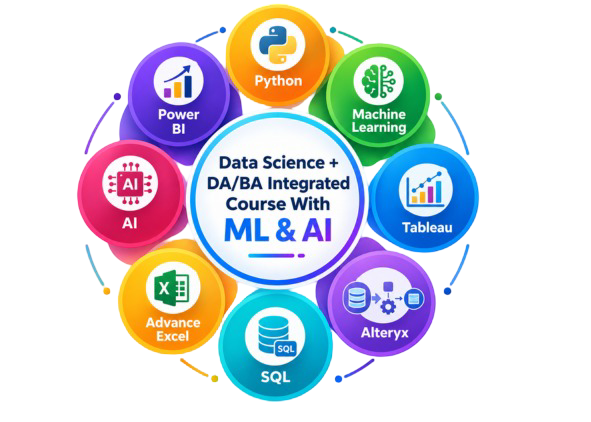
Data Science + DA/BA Integrated Course With ML & AI

Data Analytics/BA with Tableau + Power BI + SQL + Excel

Python Analytics with Machine Learning
(SQL + Excel free)

R Analytics with Machine Learning (SQL, Excel Free)

Tableau - Basic to Advance Visualization with Certification (Excel Free)


Advance Excel Training (Everything Else but VBA Coding)


Frequently Asked Questions
Power BI is a business intelligence and data visualization tool developed by Microsoft that helps users analyze data, create interactive dashboards, generate reports, and make data-driven business decisions.
Power BI is used by connecting data sources, transforming data, creating visualizations, building dashboards, and sharing reports with stakeholders for business analysis and decision-making.
You can learn Power BI by understanding data visualization concepts, dashboard creation, data modeling, and reporting techniques through structured Power BI training and hands-on projects.
To create a dashboard in Power BI, users import data, build visualizations, create reports, and pin important visuals to a dashboard for interactive business analysis.
Data modeling in Power BI is the process of creating relationships between different datasets, organizing data structures, and preparing data for accurate reporting and analysis.
Most learners can understand Power BI fundamentals within a few weeks. Advanced dashboard development, DAX calculations, and business intelligence reporting may require a few months of practice.
No, Power BI does not require extensive coding knowledge. Most reporting and dashboard tasks can be completed using its drag-and-drop interface. However, learning DAX and Power Query can help users perform advanced analytics.
A hierarchy in Power BI is created by grouping related fields such as Year, Quarter, Month, and Day into a hierarchical structure that allows users to drill down into data visualizations.
Yes, Power BI is highly in demand because organizations across industries use business intelligence tools to analyze data, create reports, and support data-driven decision-making.
Power BI in Excel refers to Microsoft’s data analysis and visualization capabilities that allow users to connect Excel data with Power BI dashboards and reports for advanced business intelligence.
A Power BI course is a professional training program that teaches dashboard creation, data visualization, business intelligence reporting, data modeling, and analytics using Microsoft Power BI.
Students, Data Analysts, Business Analysts, working professionals, managers, accountants, entrepreneurs, and beginners interested in analytics and reporting can learn Power BI.
Learning Power BI helps professionals create interactive dashboards, improve reporting skills, analyze business performance, and increase career opportunities in analytics and business intelligence roles.
Yes, Power BI is a valuable career skill because businesses increasingly rely on data visualization and business intelligence tools to make strategic decisions and improve operational efficiency.
Power BI is widely used in finance, healthcare, banking, retail, e-commerce, manufacturing, logistics, education, telecommunications, and information technology industries.
After completing Power BI training, learners can apply for roles such as Power BI Developer, Business Intelligence Analyst, Data Analyst, Reporting Analyst, MIS Executive, and Business Analyst.
DAX (Data Analysis Expressions) is a formula language used in Power BI to create custom calculations, measures, and advanced data analysis within reports and dashboards.
Yes, Power BI is beginner-friendly and can be learned by non-technical students because it focuses on visualization, reporting, and business intelligence rather than complex programming.
Power BI is known for its strong Microsoft ecosystem integration and cost-effectiveness, while Tableau is often preferred for advanced visualization and dashboard customization capabilities.
Power Query is a data transformation tool in Power BI that allows users to clean, organize, combine, and prepare data before creating reports and dashboards.
Power BI and Excel serve different purposes. Excel is ideal for spreadsheet-based analysis, while Power BI is better for handling large datasets, interactive dashboards, automated reporting, and business intelligence.
The salary of a Power BI Developer depends on skills, experience, company, and location. Due to increasing demand for business intelligence professionals, Power BI developers often receive competitive salary packages.
Power BI helps businesses visualize data, identify trends, monitor KPIs, and generate actionable insights, making it an essential tool for Business Analytics and decision-making.
Yes, many beginners from commerce, management, finance, and non-technical backgrounds successfully learn Power BI because of its intuitive interface and business-focused applications.
SQL is used for managing and retrieving data from databases, while Power BI is used for analyzing data, creating visualizations, and building business intelligence dashboards.