

10 Essential Skills Every Data Analyst Should Learn in 2026
Data can be found everywhere. Businesses make use of data in order to understand their customers, improve their products, cut down on costs, boost sales, and make better decisions. For this reason, data analysts are very much in demand in a number of industries.
What skills are needed to become a successful data analyst?
It is not necessary for you to master all programming languages or to become an expert in mathematics. Rather, you should build a solid base in data analysis, acquire the appropriate tools, and learn how to convert raw data into valuable business insights.
This article is going to look at the 10 essential data analyst skills that every beginner and anyone who wants to become a professional should learn.
Whether you are a student, working professional, or someone planning to start a career in data analytics, these skills can help you build a strong career foundation.
What is the role of Data Analyst?
It is important to understand what a data analyst really does before acquiring the necessary skills.
A data analyst gathers, cleans, examines, and presents data in order to aid businesses in making informed decisions.
For example, an e-commerce company could have orders for thousands of customers. A data analyst could then examine this information and respond to questions such as:
- Which products are selling the most?
- Which month has the highest sales?
- Which customers are buying again?
- Which marketing campaign generates the most sales?
- Why did sales go down last month?
- Which products may perform well next month?
To find these answers, the analyst makes use of tools including Excel, SQL, Python, Power BI, Tableau, and statistical methods.
The most important thing is not simply knowing a tool. A good data analyst knows how to use data to solve real business problems.
10 Essential Skills Every Data Analyst Should Learn
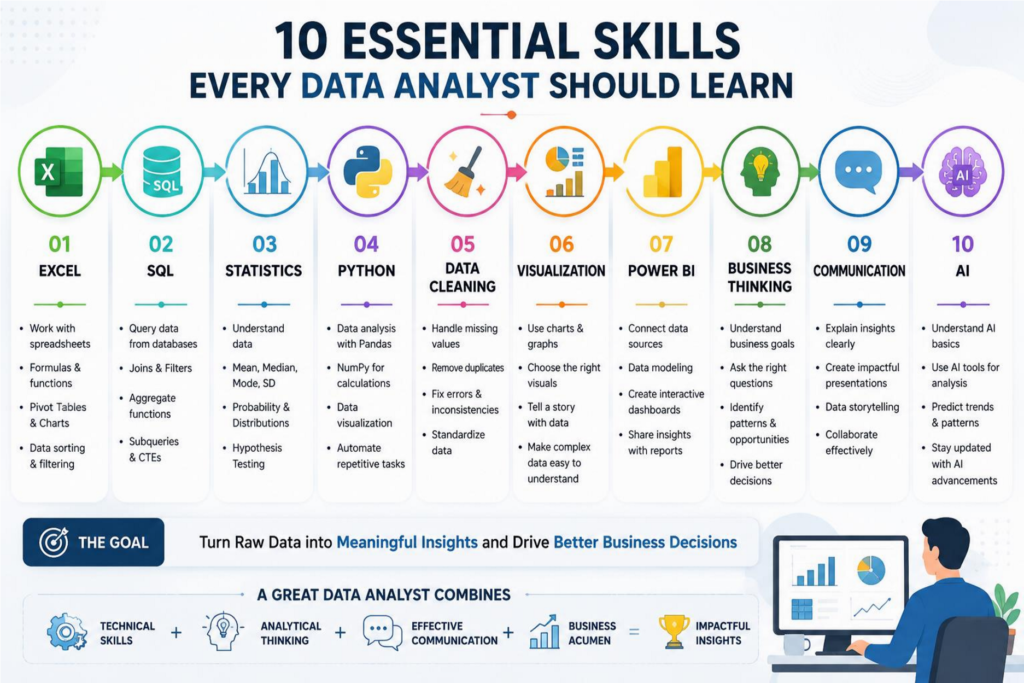
1. Skills in using Excel and Spreadsheets
Excel is one of the most useful tools for anyone starting a career in data analytics.
Many companies still use Excel for reporting, data cleaning, calculations, financial analysis, and preparing business reports.
A beginner data analyst should understand more than basic addition and subtraction.
Important Excel skills for data analysts
You should learn:
- Excel formulas and functions
- VLOOKUP and XLOOKUP
- INDEX and MATCH
- IF and IFS functions
- SUMIF and COUNTIF
- Pivot Tables
- Pivot Charts
- Conditional Formatting
- Data Validation
- Sorting and Filtering
- Removing duplicate data
- Basic data cleaning
- Creating dashboards
Excel is especially useful for working with small and medium-sized datasets.
Why Excel is important
Excel is easy to learn, is widely used, and serves as a good starting point for understanding how data works. Excel is one of the first skills you should learn if you are entirely new to data analytics.
2. SQL
Excel is useful for working with spreadsheet data, while SQL is useful for working with data that is stored in databases.
SQL stands for Structured Query Language. Data analysts use SQL to retrieve, filter, combine, and analyze information from databases.
For example, suppose an online shop has millions of customer orders. It would not be practical to open all those records in Excel.
With SQL, an analyst can quickly ask the database questions such as:
- How many orders were placed this month?
- Which product generated the most revenue?
- Which customers purchased more than five times?
- What is the top-selling products?
- How much revenue did each city generate?
Important SQL concepts to learn
Start with:
- SELECT
- WHERE
- ORDER BY
- GROUP BY
- HAVING
- JOIN
- CASE statements
- Aggregate functions
- Subqueries
- Common Table Expressions (CTEs)
- Window functions
Why SQL is important for data analysts
SQL is one of the most important technical skills for data analysts since a large number of organizations keep their business data in relational databases.
If you wish to take your work in the field of data analytics seriously then you should make it a priority to learn SQL.
Explore – Trainingya SQL Course
3. Statistics
You do not need to become a mathematician to become a data analyst, but it is necessary to understand basic statistics.
Statistics enable analysts to understand patterns, relationships, variation, and uncertainty in data.
Important statistical concepts
You should understand:
- Mean
- Median
- Mode
- Range
- Variance
- Standard deviation
- Percentages
- Probability
- Correlation
- Distribution
- Sampling
- Confidence intervals
- Hypothesis testing
For example, even if an e-commerce site’s average order value is ₹1,500, that figure by itself might not tell the whole story.
An analyst will be able to detect unusual values and gain a more accurate understanding of customer behaviour if they understand how data is distributed.
Why statistics matters
Statistics help you avoid making incorrect conclusions from data.
It allows you to ask better questions, identify patterns, and determine if the result is significant.
4. Python
Python has played an important role in modern data analytics.
While you can start your data analyst journey without Python, learning it can greatly increase the range of things you can do with data.
Python can be used to automate repetitive tasks, to clean large datasets, to carry out analysis, and to construct sophisticated data workflows.
Python libraries every data analyst should know
Some useful libraries include:
- Pandas – data manipulation and analysis
- NumPy – numerical calculations
- Matplotlib – data visualization
- Seaborn – statistical visualization
- Scikit-learn – machine learning
There is no need to learn advanced Python immediately.
Start with basic Python syntax and gradually move toward data analysis using Pandas and visualization libraries.
Why Python is useful
Python becomes especially valuable when datasets become larger or when you need to automate repetitive analytical tasks.
It can also provide a path from traditional data analysis toward data science and machine learning.
5. Data Cleaning
Raw data is rarely perfect.
A dataset may contain:
- Missing values
- Duplicate records
- Incorrect spellings
- Different date formats
- Wrong data types
- Outliers
- Inconsistent categories
- Incorrect or incomplete information
Before analyzing the data, you need to clean it.
This process is called data cleaning or data preprocessing.
Example of data cleaning
Imagine a customer database contains:
Delhi
delhi
DELHI
New Delhi
These values may represent the same location, but a computer may treat them as different categories.
A data analyst needs to identify and standardize such inconsistencies.
Why data cleaning is important
Poor-quality data can produce poor-quality insights.
This is why data cleaning is one of the most important data analysis skills to develop.
A great dashboard cannot fix incorrect data.
6. Data Visualization
Numbers and spreadsheets can be difficult to understand, especially when datasets contain thousands or millions of records.
Data visualization makes information easier to understand through charts, graphs, and dashboards.
A good data analyst should know which visualization is appropriate for a particular question.
Common types of data visualization
You should understand:
- Bar charts
- Line charts
- Pie charts
- Scatter plots
- Histograms
- Maps
- Tables
- KPI cards
- Interactive dashboards
For example:
A line chart can show sales trends over time.
A bar chart can compare sales between different products.
A scatter plot can help visualize relationships between two variables.
Popular data visualization tools
Some commonly used tools include:
- Microsoft Power BI
- Tableau
- Excel
- Python visualization libraries
- Google Looker Studio
The goal is not to create the most colorful dashboard.
The goal is to communicate important information clearly.
7. Power BI or Tableau
Learning a business intelligence tool can make your data analyst profile much stronger.
Power BI and Tableau are popular platforms for creating interactive dashboards and business reports.
With these tools, you can connect data sources, transform data, create visualizations, and build dashboards that decision-makers can use.
What should you learn?
If you choose Power BI, focus on:
- Connecting data sources
- Power Query
- Data cleaning
- Data modeling
- Relationships
- DAX basics
- Charts and visualizations
- Filters and slicers
- Dashboard design
- Publishing reports
If you choose Tableau, learn:
- Connecting data
- Worksheets
- Dimensions and measures
- Filters
- Calculated fields
- Charts
- Dashboards
- Interactive reports
Which one should you learn first?
You do not need to master both at the beginning.
Choose one BI tool, become comfortable with it, and then learn the other if your career requires it.
8. Business and Analytical Thinking
Knowing technical tools is not enough.
An analyst who is successful also must possess analytical thinking.
You should be able to look at a business problem and break it into smaller questions.
For example, imagine a company’s sales have decreased by 15%. A beginner may simply create a chart showing the decrease.
A good analyst will investigate further:
- Which products experienced the biggest decline?
- Did sales drop in a particular region?
- Did customer traffic decrease?
- Did the conversion rate change?
- Did prices increase?
- Did the marketing campaign stop?
- Did customer behavior change?
This is the difference between simply reporting data and analyzing data.
How to improve analytical thinking
Practice asking:
What happened?
Then:
Why did it happen?
And finally:
What should the business do next?
This simple approach can improve your data analysis skills significantly.
9. Communication and Data Storytelling
A data analyst may spend hours working with numbers, but the final result usually must be explained to people who are not experts in data.
It shows that communication is an essential skill.
Imagine you discovering that a particular marketing campaign increased sales by 25%.
Simply showing the number is not enough.
You should be able to explain:
- What happened?
- Why did it happen?
- What data supports the conclusion?
- What does it mean for business?
- What action should the company take?
This is called data storytelling.
A simple data storytelling structure
You can structure your presentation like this:
Problem → Data → Insight → Recommendation
For example:
Problem: Online sales have declined.
Data: The website traffic stayed the same, but the number of conversions during the checkout process fell.
Insight: People are going to the website, but less of them are making purchases.
Recommendation: Look into the checkout process and carry out an A/B test in order to improve conversion.
Good communication can turn a complicated analysis into a simple business story.
10. Artificial Intelligence and Machine Learning Basics
People are now working with data differently because of artificial intelligence.
It is not essential for data analysts to become machine learning engineers, but having a basic understanding of AI and machine learning can be very useful.
AI tools can help analysts with tasks such as:
- Data exploration
- Writing SQL queries
- Generating formulas
- Finding patterns
- Summarizing data
- Automating repetitive tasks
- Creating reports
- Predictive analysis
What is it that a beginner should learn?
Start with basic concepts such as:
- What is artificial intelligence?
- What is machine learning?
- Supervised learning
- Unsupervised learning
- Regression
- Classification
- Clustering
- Predictive analytics
- Model evaluation
You should also learn how to use AI in a responsible way.
When results are produced by AI they must be checked against the original data since wrong inputs or assumptions can lead to incorrect conclusions.
Why AI matters for future data analysts
The role of a data analyst is increasingly becoming more technology oriented.
Learning AI can help you automate routine tasks so that you have more time for more valuable work, like problem-solving, interpretation, and decision-making.
Bonus Skill: Data Ethics and Privacy
Data analysts usually have to work with sensitive information about businesses and customers.
It is important to understand data ethics.
You should know how to:
- Protect confidential information
- Avoid unnecessary exposure of personal data
- Use data responsibly
- Understand basic privacy principles
- Avoid misleading visualizations
- Report findings honestly
It is important to be technically skilled, but it is just as important to use data responsibly.
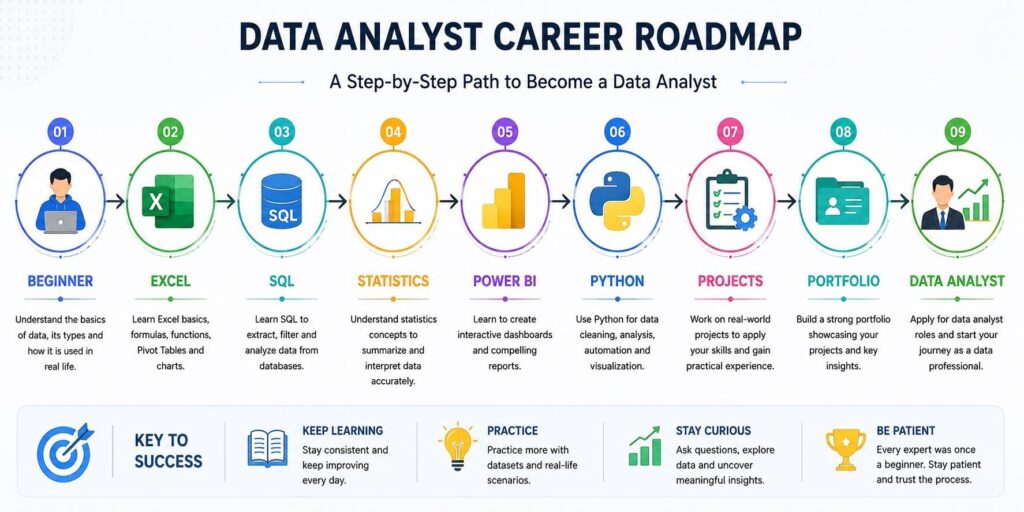
How to Learn Data Analyst Skills as a Beginner
It is not necessary for you to learn all the information at the same time.
A simple learning path can look like this:
Step 1: Learn Excel
Start with the use of formulas, Pivot Tables, charts, filtering, and data cleaning.
Step 2: Learn Basic Statistics
Learn about averages, percentages, distributions, correlation, and basic probability.
Step 3: Learn SQL
Practice writing queries and working with databases.
Step 4: Learn Data Visualization
Choose Power BI or Tableau and build dashboards.
Step 5: Learn Python
Start with Python basics and then learn Pandas, NumPy, and visualization.
Step 6: Work on Real Projects
Create projects using real or publicly available datasets.
Step 7: Build a Portfolio
Show your dashboards, SQL projects, Python analysis, and business insights.
Step 8: Learn AI Tools
Learn how AI can be used to carry out data analysis while at the same time finding out how to verify the results generated by AI.
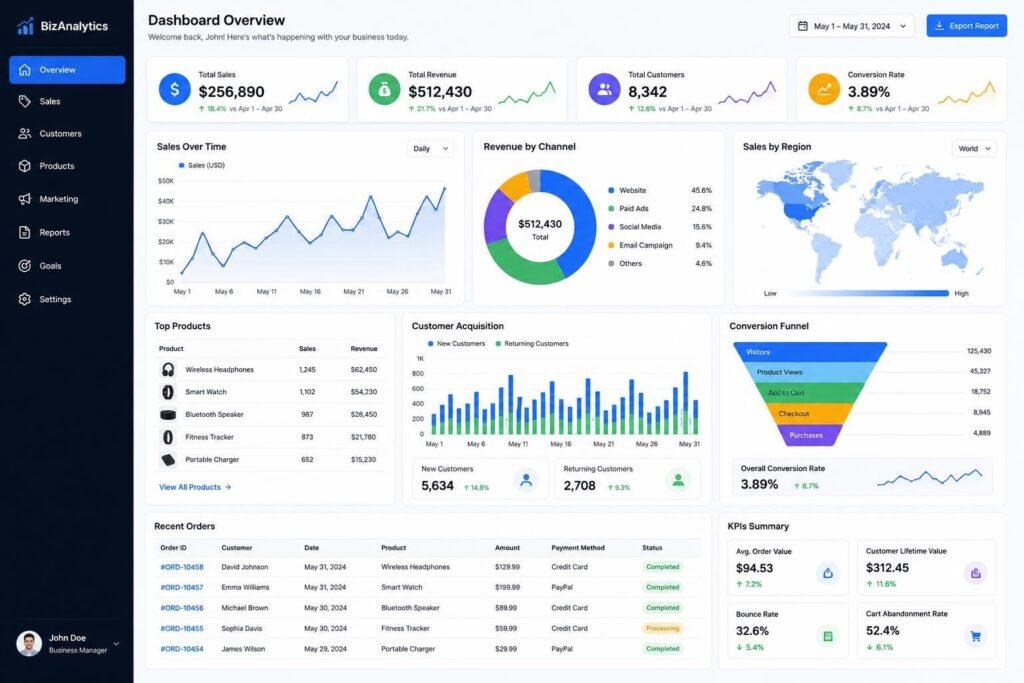
Data Analyst Skills Roadmap
| Skill | Priority for Beginners | Main Purpose |
| Excel | High | Spreadsheet analysis |
| SQL | Very High | Database querying |
| Statistics | High | Understanding data |
| Data Cleaning | Very High | Preparing reliable data |
| Power BI/Tableau | High | Dashboards and reporting |
| Python | High | Advanced analysis and automation |
| Data Visualization | High | Communicating insights |
| Business Thinking | Very High | Solving business problems |
| Communication | Very High | Presenting insights |
| AI & Machine Learning | Growing | Automation and predictive analysis |
How Long Does It Take to Learn Data Analytics?
The amount of time needed will vary according to your existing background, the pace at which you learn, and the amount of practice you carry out. A person who starts out and studies regularly will be able to develop basic skills over a period of several months. Rather than concentrating just on finishing courses, one should concentrate on practical projects.
For example, you could analyze:
- E-commerce sales
- Customer behavior
- Marketing campaign performance
- Employee data
- Financial transactions
- Website traffic
- Product reviews
Projects help you understand how different skills work together.
Common Mistakes Beginners Make
Trying to Learn Every Tool
You do not need to learn every analytics tool.
Start with Excel, SQL, one visualization platform, and basic Python. Expand your skills as you progress.
Focusing Only on Certificates
While certificates can show that you have completed a course, practical skills and projects are just as important.
Ignoring Statistics
While tools can do the calculations for you, it is necessary to use statistics in order to understand what the numbers actually mean.
Creating Complicated Dashboards
The purpose of a dashboard should be to make information easier to understand rather than more difficult. Make sure that your visualizations are clear and concentrate on the key metrics.
Not Practicing with Real Data
Watching tutorials is useful, but you improve much faster when you actually work with datasets and solve problems.
What Skills Do Employers Look for in a Data Analyst?
The requirements differ from company to company and from role to role, but in the case of many data analyst positions, a mix of technical and soft skills is highly valued.
Some commonly requested skills include:
- SQL
- Excel
- Data visualization
- Power BI or Tableau
- Statistics
- Python
- Data cleaning
- Analytical thinking
- Business understanding
- Communication
- Problem-solving
The exact combination depends on the industry and job role.
For example, a marketing data analyst may need strong knowledge of marketing metrics and customer behavior, while a financial analyst may focus more on financial reporting and forecasting.
Frequently Asked Questions
Data analytics can feel difficult at first because you need to learn several concepts and tools. However, you can learn it step by step.
You can start without advanced coding skills. Excel and SQL are excellent starting points.
Learning Python, on the other hand, can provide you with a greater number of opportunities in the areas of automation, advanced analysis, and career advancement.
Although Excel is a valuable skill, relying only on Excel may limit you for many data analyst roles. Learning SQL and using a visualization tool like Power BI or Tableau can make your skill set much stronger.
SQL is an excellent first technical skill for most beginners since it is widely used when querying business databases. After becoming comfortable with SQL, you can learn Python for more advanced analysis and automation.
Yes. People from business, commerce, marketing, finance, and other backgrounds can move into data analytics. The key is to build the required technical skills and practice solving real-world problems with data.
There is no single skill that makes someone a great data analyst. SQL, Excel, statistics, visualization, business understanding, analytical thinking, and communication all work together.








Leave a Reply