
Power BI vs. Tableau for Data Analysts: What’s the Difference?
A hands-on comparison of data preparation, engine performance, visualization, teamwork, AI, cost, and how useful it is for your career.
Usually, data analysts do not select a BI platform on their own, since the best option depends on the company’s data setup, reporting requirements, governance arrangements, audience, and the type of analysis needed. Microsoft Power BI and Tableau are the two most frequently chosen options for analytics teams.
Both tools can connect to a wide range of data sources, manipulate and model data, create interactive dashboards, and share insights. The true difference lies not in their capability to produce dashboards, but in the way each one fits into the current analytics process.
A quick comparison of Power BI and Tableau
| Area | Power BI | Tableau |
| Core strength | Integrated business intelligence and semantic modeling | Interactive visual analytics and exploration |
| Primary Engine | VertiPaq (In-Memory Columnar) / Direct Lake | Hyper (In-Memory Data Engine) / Live Query |
| Data preparation | Power Query and related Microsoft data capabilities | Tableau Prep plus data connections and transformation |
| Modeling | Strong semantic modeling with DAX and relationships | Strong analytical layer with flexible data connections and calculations |
| Visualization Style | Structured, grid-aligned report canvas with modular visuals | Freeform visual mark cards (Color, Size, Detail, Path) |
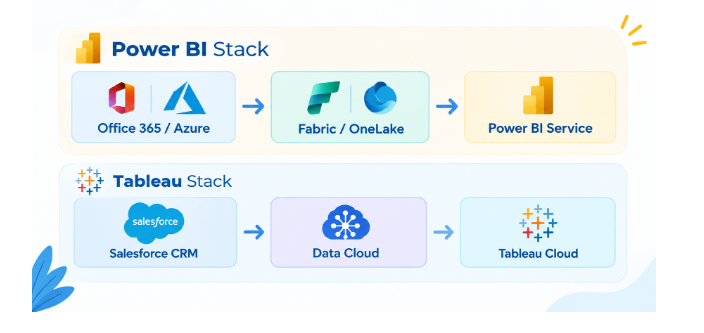
| Ecosystem | Deep Microsoft 365, Azure, and Fabric integration | Strong Salesforce ecosystem and enterprise connectivity |
| AI Direction | Copilot and AI-assisted analytics within Microsoft Fabric/Power BI | Tableau Agent and Tableau Pulse |
| Deployment | Power BI Service, Desktop, and Fabric/capacity options | Tableau Cloud, Tableau Server, and Desktop |
A quick comparison of Power BI and Tableau1. Data Preparation: Comparing Power Query and Tableau Preparation
Data analysts spend a great deal of their time preparing data before creating visualisations. A dashboard, no matter how well designed, cannot overcome data that is messy, duplicated, or poorly organised.
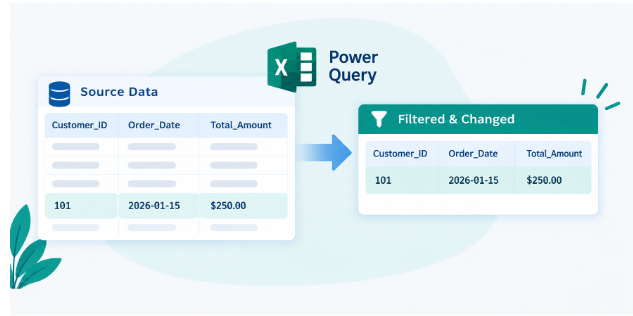
Power BI imports, cleans, reshapes, combines, and transforms data using Power Query. As stated in the Microsoft PL-300 certification, data preparation, profiling, transformation, relationships, and modelling are all essential elements of an analyst’s job. Since Power Query maintains a step-by-step record of the changes made in M-code, data preparation can be easily reviewed and repeated.
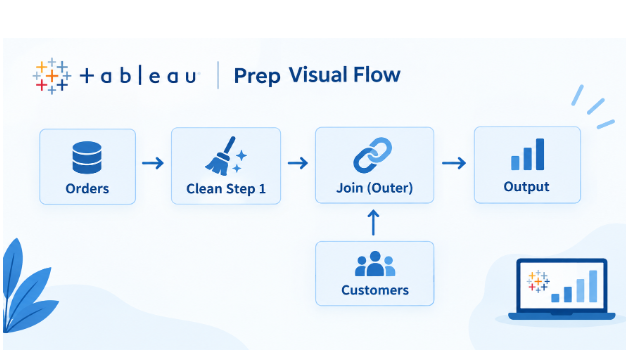
Tableau Prep is used for data preparation and goes together with Tableau Desktop; it allows analysts to join, clean and pivot the data using a visual, step-by-step flow before they create a Hyper file.
- The main point is that Power Query is most suitable for carrying out structured ETL tasks through the use of the standard interface steps, while Tableau Prep is better for visually mapping out complex joins and for keeping track of how the data changes as it goes through the splits.
2. A detailed examination of engine performance and architecture (VertiPaq VS Hyper)
For large companies, engine speed can mean the difference between a report loading in 200 milliseconds or taking 30 seconds.
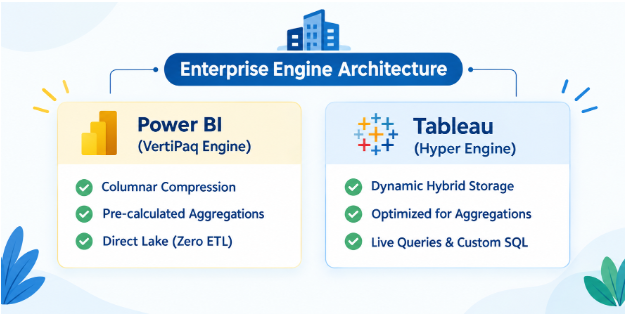
Power BI: VertiPaq & Direct Lake
Power BI is based on the VertiPaq engine, which is an in-memory columnar database that has been optimised for compression and fast aggregation.
- When in Import Mode, VertiPaq uses dictionary and run-length encoding to compress the data, and it performs most effectively when scanning billions of rows to calculate totals or averages, provided that the DAX measures do not need row-by-row calculations.
- In Power BI, when you use Direct Lake mode, you skip the normal data-loading step. It accesses Delta Lake tables in OneLake directly, so there is no need to import or copy the data. As a result, it delivers fast performance even when working with very large live datasets.
Tableau: Hyper Engine & Live Connections
Tableau uses the Hyper engine, which is a high-performance, in-memory data engine developed for fast data ingestion and analytical queries.
- In Hyper Extracted Mode Tableau combines transactional and analytical processing, which enables users to create extracts quickly and means that the dashboards remain fast even when there are many filters and visuals.
- When carrying out live queries, Tableau forwards direct queries to cloud data warehouses such as Snowflake, Databricks, or BigQuery and makes use of the warehouses’ own computing power whenever complex joins are required.
- Our assessment is that Power BI’s VertiPaq and Direct Lake are well suited to dealing with large and complex data models that involve central logic, while Tableau’s Hyper engine is the best choice when it comes to enabling fast, interactive filtering on broad datasets and providing smooth connections to data warehouses.
3. Visualisation Canvas and Interface Design
It is in the area of visualisation that the two tools most differ from each other in both their operation and the way in which you design reports.
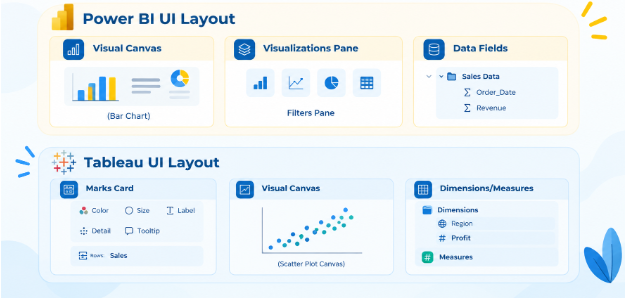
Power BI: Structured Canvas & Semantic Layer
Power BI features a traditional drag-and-drop layout arranged in a fixed grid when constructing reports.
- In the Visuals Pane users can select from the various built-in chart types such as Bar, Line, Matrix, or Decomposition Tree before dragging the fields into the different areas like Axis, Legend, or Values.
- Power BI is concerned with standard business reports, features structured cross-filtering, and ensures consistent delivery of KPIs for companies.
Tableau: Marks Card & Exploratory Analytics
Tableau produces visuals by using Marks, such as Colour, Size, Shape, Text, and Detail, as well as the Columns and Rows shelves.
- Using the Marks Card, analysts are able to create almost any kind of custom chart—such as bump charts or layered maps—by combining various Marks.
- Tableau is created so that you can carry out in-depth data exploration, discover trends, and tell stories using visuals.
4. AI and the contemporary analytics workflow
Both platforms now include AI features that speed up the analytics process.
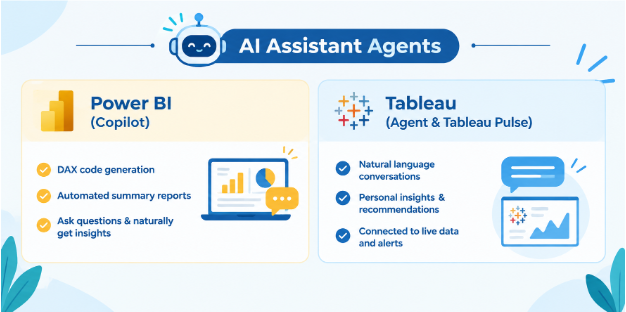
- Copilot in Power BI, included in Microsoft Fabric, can help with natural language queries, page creation, plain-language summaries, and setting up rules to configure data.
- Tableau’s Agent allows calculations and visuals to be created using input similar to that of a chat. Tableau Pulse sends personalised metric updates, trend summaries, and analysis directly to Slack, email, or your phone.
5. Ecosystem, Licensing, and Total Cost of Ownership (TCO)
The final decision as to which platform is selected is usually based on price and the company’s requirements.
Pricing Comparison (as of late 2026)
- Power BI Pro: The price is $14 per user per month (on an annual basis). Regional prices apply (for example, ₹1,165 per user per month in India, excluding GST). Premium capacity has mostly been transferred into Microsoft Fabric F-SKUs for extended enterprise computing.
- Tableau Standard and Tableau Enterprise have starting prices of US$15 per user per month and US$35 per user per month respectively (on an annual basis). The Tableau Desktop Free Edition is available for personal use on a desktop computer with certain publishing restrictions.
6. What Skills Are More Important Than the Tool?
While knowing how to use these tools helps, strong analytics skills drive a successful career.
- SQL is used to query databases, validate engine outputs, and create efficient staging views.
- Data modelling: understanding the star schema, the snowflake schema, dynamic filtering, and cardinality.
- Business acumen involves defining significant KPIs and converting raw metrics into specific decisions.
- Visual design principles include reducing clutter, making reports accessible, and choosing the right chart types.
- Data governance and security cover row-level security (RLS), data classification, and workspace permissions.
Frequently Asked Questions (FAQ)
It’s best to become proficient with both tools, but start by focusing on one. Start by learning data modelling, SQL, and business storytelling with either Power BI or Tableau. After you learn the basics, picking up the second tool will be much easier.
Power BI is growing rapidly because of its low cost and integration with Microsoft 365. However, Tableau is far from disappearing and remains the preferred option for advanced visuals, data storytelling, and in-depth analysis in technology-oriented companies.
You don’t need any programming experience when creating simple reports in either of the two tools, but studying SQL does make a big difference if you’re working with data. For more advanced features, Power BI uses DAX and M, while Tableau uses calculated fields and Level of Detail (LOD) expressions.
Both tools can handle large datasets well, provided they are set up correctly. Tableau’s Hyper Data Engine is known for fast in-memory extracts, while Power BI uses VertiPaq and DirectQuery to connect quickly to cloud platforms such as Azure Synapse and Snowflake.
It takes 6 to 8 weeks of regular training and practice to learn the basics and put together a portfolio. Usually, it takes 3 to 6 months of actual project work to master advanced calculations such as complex DAX or Tableau LODs.
Final Takeaway
Both Power BI and Tableau can turn data into useful business insights, but each has its own advantages. Power BI is best for standard corporate metrics and structured data models, and it integrates well with Microsoft Fabric. Tableau is particularly notable for flexible visual analysis, custom visuals, and easy connections to a wide range of data sources.
Learn data modelling, SQL, and how to present your analysis. When you’ve acquired these basic skills, apply them using the platform used by the company you have chosen.




![Best Microsoft Power BI Courses & Certificates [2026]](https://www.trainingya.com/wp-content/uploads/2026/05/Learn-Python-in-2026-450x231.webp)




Leave a Reply