

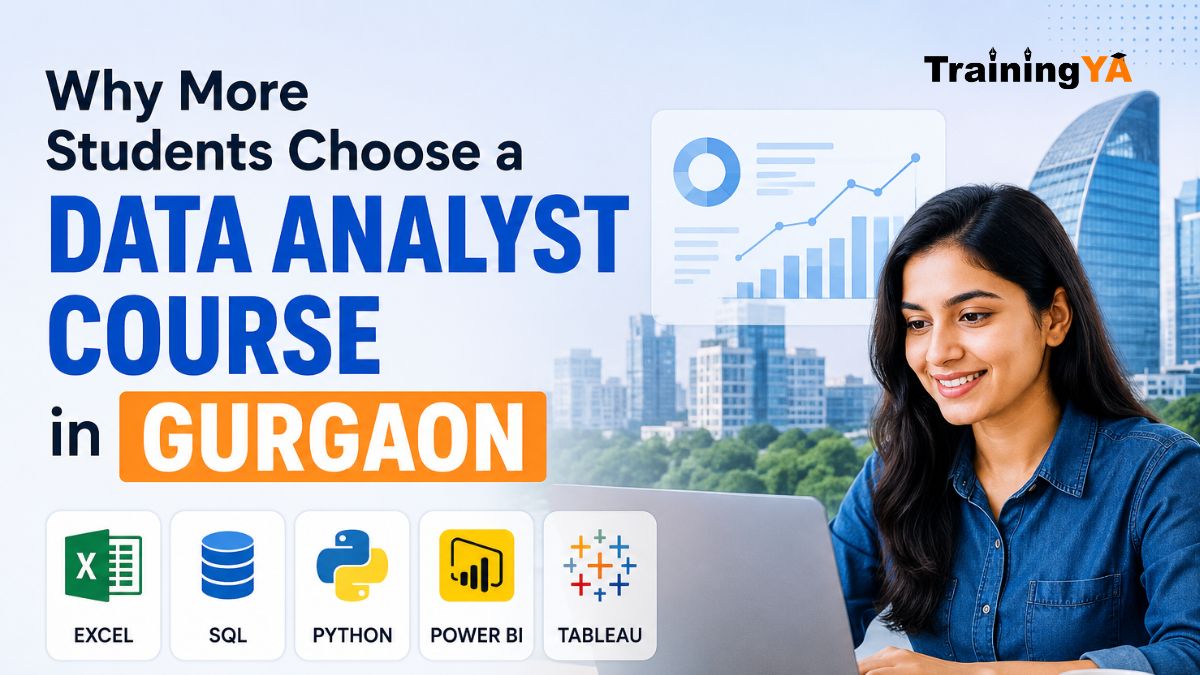
Why More Students Choose a Data Analyst Course in Gurgaon
Not long ago, if you asked a classroom full of students what they wanted to do after graduation, the answers were fairly predictable. Someone wanted a government job, someone was preparing for software development, and others planned to pursue an MBA. Very few people would have said, “I want to become a data analyst.”
Today, that conversation has changed.
Companies across almost every industry are hiring people who can work with data. Open any major job portal and you’ll see vacancies for Data Analysts, Business Analysts, MIS Executives, Reporting Analysts, Power BI Developers, and SQL Analysts. These aren’t niche roles anymore—they’ve become an important part of how modern businesses operate.
Interestingly, many of the people working in analytics never set out to build a career in this field.
I’ve met commerce graduates who started in back-office reporting and gradually moved into analytics. I’ve spoken with engineers who realized software development wasn’t for them but genuinely enjoyed solving business problems with data. I’ve even seen professionals from operations and customer support switch careers after learning Excel, SQL, and Power BI.
That’s one of the biggest strengths of analytics: it welcomes people from different educational and professional backgrounds.
If you’re searching for a Data Analyst Course in Gurgaon, you’re probably trying to answer a simple question:
Is this career worth investing my time and money in?
The honest answer is yes—but only if you learn the right skills and practice them on real business problems. A certificate alone won’t change your career. Your ability to understand data and explain what it means will.
Must Read : Benefits of Advance Excel Course
Data Is Everywhere—But It Doesn’t Explain Itself
Every business generates information throughout the day.
A customer places an order. Someone cancels a subscription. A marketing campaign attracts new visitors. Products are returned. Payments are delayed. Website traffic goes up. Sales go down.
All of these activities create data.
The problem is that raw numbers don’t automatically tell a story.
Imagine you’re managing an online fashion store. At the end of the month, you notice revenue has dropped by 15%. The sales report confirms the decline, but it doesn’t explain why it happened.
Was the problem limited to one city?
Did returning customers stop buying?
Was a particular product category underperforming?
Did a recent advertising campaign fail to attract quality customers?
Or was there a technical issue on the website that affected mobile users?
Without careful analysis, every answer is just a guess.
This is exactly where a data analyst becomes valuable. Their job isn’t simply to prepare reports. They dig into the information, connect different data sources, identify patterns, and help decision-makers understand what is really happening.
The final report might look clean and simple, but there’s often a lot of thinking behind it.
A Data Analyst Solves Business Problems, Not Just Technical Ones
Many beginners assume analytics is all about coding.
That’s probably because social media often shows dashboards, SQL queries, and Python scripts without explaining why they’re being used.
In reality, experienced analysts spend a large part of their day asking questions before they ever write a query.
Suppose a company’s profits have been falling for three consecutive months.
The first question isn’t, “Which SQL command should I use?”
Instead, the conversation starts with questions like these:
- Has overall sales volume declined?
- Are operating expenses increasing?
- Which products have the lowest profit margins?
- Have customer acquisition costs increased?
- Are repeat customers purchasing less frequently?
Only after understanding the business problem does an analyst decide which data needs to be collected and which tools should be used.
That’s why companies don’t hire analysts simply because they know SQL or Power BI. They hire people who can connect data with business decisions.
Why Gurgaon Has Become a Strong Destination for Analytics Careers
Location doesn’t guarantee success, but it can certainly create opportunities.
Over the last decade, Gurgaon has grown into one of India’s busiest business hubs. From multinational companies and consulting firms to startups, banks, healthcare organizations, and e-commerce businesses, thousands of organizations now operate across Cyber City, Udyog Vihar, Golf Course Road, and nearby commercial areas.
Most of these companies rely on data in one way or another.
Sales teams track revenue trends. HR departments monitor hiring metrics. Marketing teams analyze campaign performance. Finance departments prepare forecasting reports. Operations managers study efficiency and customer satisfaction.
Behind many of these reports is someone working in analytics.
For students, this creates an advantage. Learning through a Data Analytics Course in Gurgaon means you’re studying in a city where employers are actively looking for these skills. You hear about interview experiences, understand what companies expect from freshers, and get a clearer picture of the skills that actually matter in the workplace.
Must Read : Best Microsoft Power BI Courses & Certificates [2026]
Can Students from Non-Technical Backgrounds Become Data Analysts?
This is probably the question trainers hear most often.
The short answer is yes.
Analytics is one of the few technology-related careers where your educational background is often less important than your practical ability.
Commerce graduates bring financial understanding. Engineers are comfortable with logical thinking. Marketing professionals understand customer behaviour. Operations executives already know business processes.
Each of these backgrounds offers a different advantage.
What employers really want is someone who can look at information, identify trends, and explain those findings clearly.
Of course, technical skills are important too. You’ll need to learn tools like Excel, SQL, Power BI, Python, and Tableau. But those tools become far more useful when you understand the business question you’re trying to answer.
That’s why the best learning approach combines technical training with real business case studies instead of teaching software in isolation.
The Skills That Actually Help You Get Hired
One mistake I see quite often is students trying to learn every analytics tool at once.
They watch one video on Python, another on Tableau, then switch to SQL before they’ve even understood Excel. After a few weeks, they know a little about everything but aren’t confident with anything.
A better approach is to learn the tools in the same order they’re commonly used in real organizations.
Microsoft Excel: The Starting Point
Some students assume Excel is outdated because everyone talks about AI and automation.
That couldn’t be further from the truth.
Walk into the reporting or finance department of almost any company, and you’ll still find Excel open on someone’s screen.
Why?
Because it’s quick, flexible, and ideal for cleaning data, checking calculations, preparing reports, and creating summaries.
A strong Excel user knows much more than basic formulas. They understand Pivot Tables, XLOOKUP, INDEX-MATCH, Power Query, Conditional Formatting, charts, dashboards, and data validation.
These features save hours of manual work and are still part of many analytics interviews.
Must Read : Top 15 Most Demanding Courses in Future
SQL: Learning to Ask the Right Questions
Imagine a company has information on five million customers.
No one is going to scroll through a spreadsheet with five million rows.
That’s where SQL becomes essential.
SQL allows analysts to pull only the data they need.
For example:
- Show customers who purchased in the last 30 days.
- Find products with the highest return rate.
- Calculate monthly revenue by city.
- Identify customers who haven’t purchased in six months.
Notice something?
These aren’t technical questions.
They’re business questions.
SQL is simply the language that helps you find the answers.
That’s why recruiters often ask SQL questions during interviews. They aren’t trying to test whether you memorized commands. They want to see whether you understand how to use data to solve business problems.
Power BI: Turning Numbers Into Stories
Suppose your manager receives a spreadsheet with 25,000 rows of sales data.
Will they read every row?
Probably not.
Now imagine showing the same information through an interactive dashboard.
Within a few seconds, they can identify:
- Which products generate the highest revenue
- Which cities are performing below expectations
- Monthly sales trends
- Profit margins
- Customer growth
- Regional performance
That’s the purpose of Power BI.
It transforms complicated datasets into reports that anyone in the business can understand.
The best dashboards aren’t the most colorful ones.
They’re the ones that help people make decisions quickly.
Python: Making Large Datasets Easier to Handle
When students hear the word “Python,” many immediately think of software development.
In analytics, Python is used differently.
Think of it as an assistant that handles repetitive work.
Instead of cleaning hundreds of files manually, Python can automate the process.
Instead of repeating the same calculations every week, Python can perform them in seconds.
As your career grows, you’ll work with larger datasets that are difficult to manage using spreadsheets alone.
That’s where Python becomes extremely valuable.
The good news is that you don’t need to become a software engineer to use it effectively for data analysis.
Tableau: Another Skill Employers Appreciate
While many Indian companies have adopted Power BI, Tableau continues to be widely used by multinational organizations, consulting firms, and global enterprises.
The concepts remain largely the same.
You’re still working with data.
You’re still identifying trends.
You’re still building dashboards.
Learning Tableau alongside Power BI makes you more flexible when applying for jobs because different organizations prefer different reporting platforms.
Why Practical Projects Matter More Than Certificates
Here’s something many students don’t realize until they attend interviews.
Recruiters rarely spend much time discussing your certificate.
Instead, they ask questions like:
“Tell me about a project you’ve worked on.”
That’s where many candidates struggle.
They’ve completed online videos but haven’t applied those concepts to real data.
Imagine two candidates.
The first says,
“I know SQL and Power BI.”
The second says,
“I analyzed sales data for an e-commerce company, identified the lowest-performing product categories, and built a dashboard that tracked monthly revenue, customer retention, and regional performance.”
Who do you think leaves a stronger impression?
Projects demonstrate experience.
They show that you know how to solve problems rather than simply remember theory.
At Training YA, students don’t just watch demonstrations. They work on projects that resemble real business situations.
For example, you might:
- Build a sales dashboard using Power BI.
- Analyze customer purchase behavior.
- Clean messy datasets using Excel and Python.
- Write SQL queries to generate business reports.
- Create executive dashboards for management.
By the end of the course, you’ll have work that you can confidently discuss during interviews.
Why Many Students Still Prefer Offline Learning
Online learning has made education more accessible than ever.
You can learn almost anything from home.
But accessibility doesn’t always lead to consistency.
Most people have enrolled in at least one online course they never finished.
Life gets busy.
Work becomes hectic.
Notifications become distractions.
Before you know it, weeks have passed without opening another lesson.
Offline learning creates a different environment.
When you attend regular classes, you’re following a schedule. You interact with instructors, ask questions immediately, and learn alongside other students who are working toward similar goals.
One student’s question often answers a doubt you didn’t even realize you had.
That kind of interaction is difficult to recreate through recorded videos.
For many beginners, this structured environment makes learning faster and more enjoyable.
Must Read : Python Developer Roadmap for Beginners in 2026
What You’ll Learn in the Training YA Data Analyst Course in Gurgaon
The objective of our program isn’t simply to teach software.
We want students to understand how businesses actually use data to make decisions.
The course covers:
- Advanced Microsoft Excel
- SQL for Data Analysis
- Python Fundamentals for Analytics
- Power BI Dashboard Development
- Tableau Visualization
- Statistics for Business Analysis
- Data Cleaning Techniques
- Business Reporting
- Dashboard Design
- Real-Time Case Studies
- Resume Building
- Mock Interviews
- Placement Assistance
Rather than teaching each tool in isolation, we combine them into practical workflows.
For example, students learn how to extract data using SQL, clean it in Excel or Python, analyze trends, and finally present the results through interactive dashboards in Power BI or Tableau.
This mirrors the process followed in many organizations and helps students understand how different tools work together.
Analytics Is About Curiosity More Than Coding
One quality separates great analysts from average ones.
Curiosity.
The best analysts don’t stop after finding an answer.
They ask another question.
Then another.
Why did sales increase in one region but not another?
Why do customers leave after their second purchase?
Why is one marketing campaign performing better than the rest?
Those questions often lead to insights that help businesses improve.
Software helps you process information.
Curiosity helps you discover opportunities.
That’s something no certificate can teach on its own.










Leave a Reply